Implementing "Momo" Trading Strategy in QuantConnect
Overview
QuantConnect is an online platform where you can create trading algorithms, backtest them against data from brokers and go live with it if you want to do so. All of this can be done for free "Paper trading" and is a great solution to testing trading strategies.
Algorithms in QuantConnect can be in either C#, Python or F#. We will use Python for this blog post and Oanda as a broker. Also Oanda offers a free 512mb server to put your algorithm live if you want to do so.
"Momo" Strategy
The "Momo" strategy is an investment strategy inspired from Investopedia. The algorithm implemented here is different parameters-wise but the entry strategy is the same.
It uses 2 indicators: 20 Exponential Moving Average (EMA) and 12,26,9 Moving Average Convergence Divergence(MACD).
Feel free to read about them or indicators before proceeding ahead.
Long Entry Rule: Closing Price < EMA and MACD < 0
Short Entry Rule: Closing Price > EMA and MACD > 0
Exit: Trailing Stop loss
The Algorithm
Phases
There are different phases(not sure about the correct terminology but I call it that) in the algorithm, for example in ours there is an Initialisation phase and then a Data phase.
The initialisation phase is used to set up our starting parameters and global variables. Our algorithm is stateful and uses variables to keep track of take profit and stop losses. In production(if you are using QuantConnect) you would want to make your algorithms as stateless as possible because downtimes and restarts can happen. However, if you use QuantConnect to most research and backtest algorithms like me then you don't need to worry about that.
The data phase happens at every tick of the data.
Full Code
As you can see we start by setting our Forex Symbol to be used as EURUSD (you can also trade Equities, Futures, Options, Cryptos and CFDs check the website for more information). We choose the period between which we want to backtest and the amount of starting capital. Then we choose the tick at which we will take data. We initialise our indicators and other variables. The indicators are thoroughly documented on QuantConnect's documentation section.
Then using OnData function, for every tick that we get, in this case every minute, we check if we have a position open. In our case we are keeping only 1 position open. Then we implement our entry and exit rules. Finally in the last section if we have a position open we check whether we have hit our stop loss, in which case we liquidate our position or if we have hit our take profit here we have implemented a trailing stop loss.
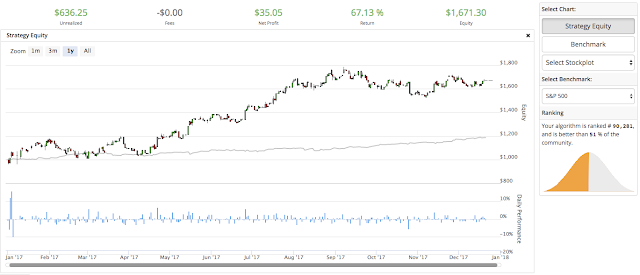
If you backtest the algorithm as it is, you should get the following:
Final Words
Note that the nature of markets(trending, ranging, random or ?) change all the time and an algorithm will not perform the same for every different kind of market.
But as usual feel free to comment if you have any question.
Happy New Year!
There are potential risks relating to investing and trading. You must be aware of such risks and familiarize yourself in regard to such risks and seek independent advice relating thereto. You should not trade with money that you cannot afford to lose. This website and its content should not be construed as a solicitation to invest and/or trade. You should seek independent advice in this regard. Past performance is not indicative of future performance. No representation is being made that any results discussed within the service and its related media content will be achieved. All opinions, news, research, analyses, prices or other information is provided as general market commentary and not as investment advice. This website and its creators do not warrant the completeness, accuracy or timeliness of the information supplied, and they shall not be liable for any loss or damages, consequential or otherwise, which may arise from the use or reliance of this website and its content.
Happy New Year!
Disclaimer
There are potential risks relating to investing and trading. You must be aware of such risks and familiarize yourself in regard to such risks and seek independent advice relating thereto. You should not trade with money that you cannot afford to lose. This website and its content should not be construed as a solicitation to invest and/or trade. You should seek independent advice in this regard. Past performance is not indicative of future performance. No representation is being made that any results discussed within the service and its related media content will be achieved. All opinions, news, research, analyses, prices or other information is provided as general market commentary and not as investment advice. This website and its creators do not warrant the completeness, accuracy or timeliness of the information supplied, and they shall not be liable for any loss or damages, consequential or otherwise, which may arise from the use or reliance of this website and its content.


Comments
Post a Comment